
IoT Platform Based Energy Management System

General
The Acrel-EIoT Energy Internet of Things Open Platform is a platform based on the Internet of Things data center to establish a unified uplink and downlink data standard to provide Internet users with energy Internet of Things data services. Users only need to purchase the Acrel IoT sensor, select the gateway, and scan the code after installing it themselves to obtain the required industry data services using mobile phones and computers.
Data service: Internet users do not need to pay attention to the platform itself, but only to the industry data service obtained after purchasing the hardware, namely the PAAS service.
Data subscription: The system integrator no longer needs to know the structure and protocol of the downlink hardware, obtain data through the platform interface, or push data from the platform to the application subsystem.
Structure
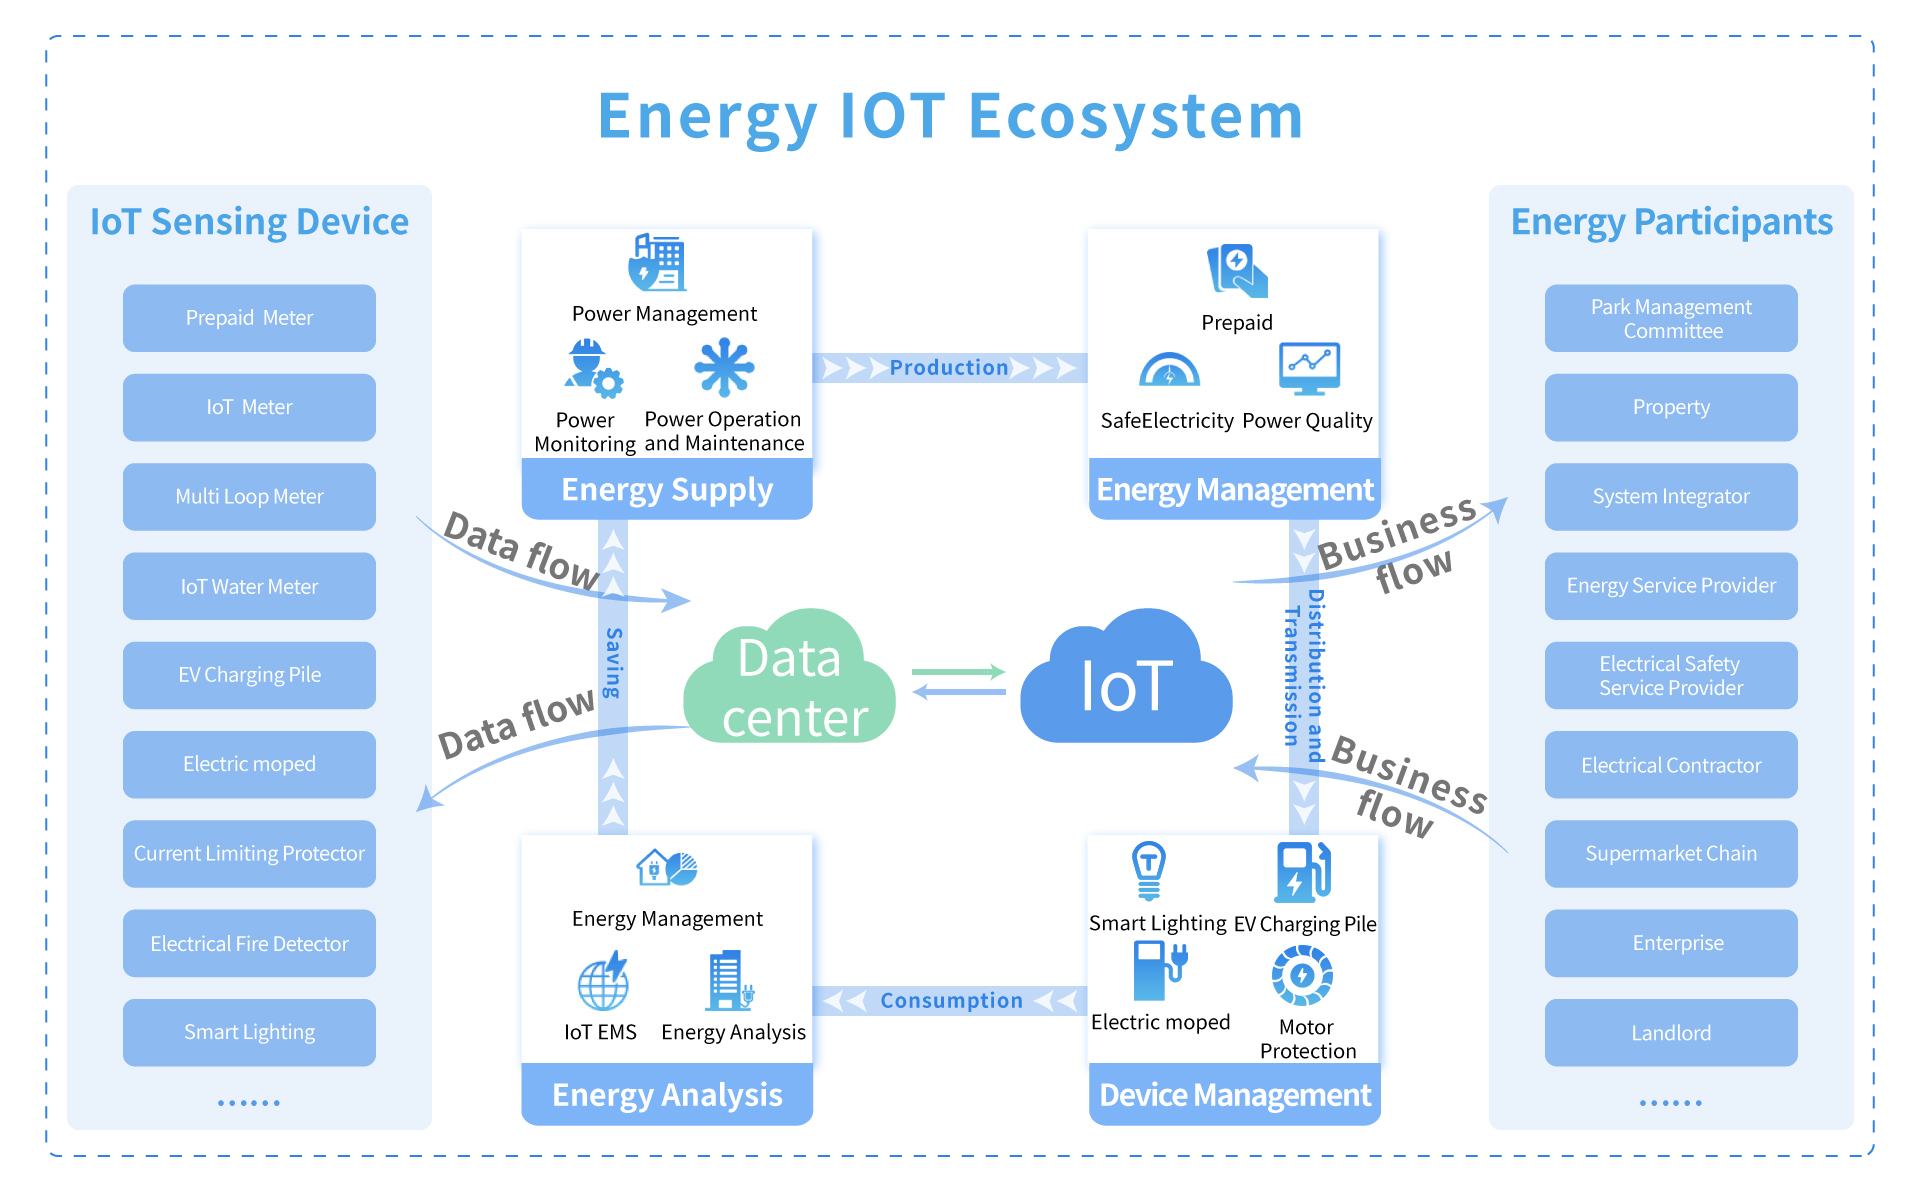
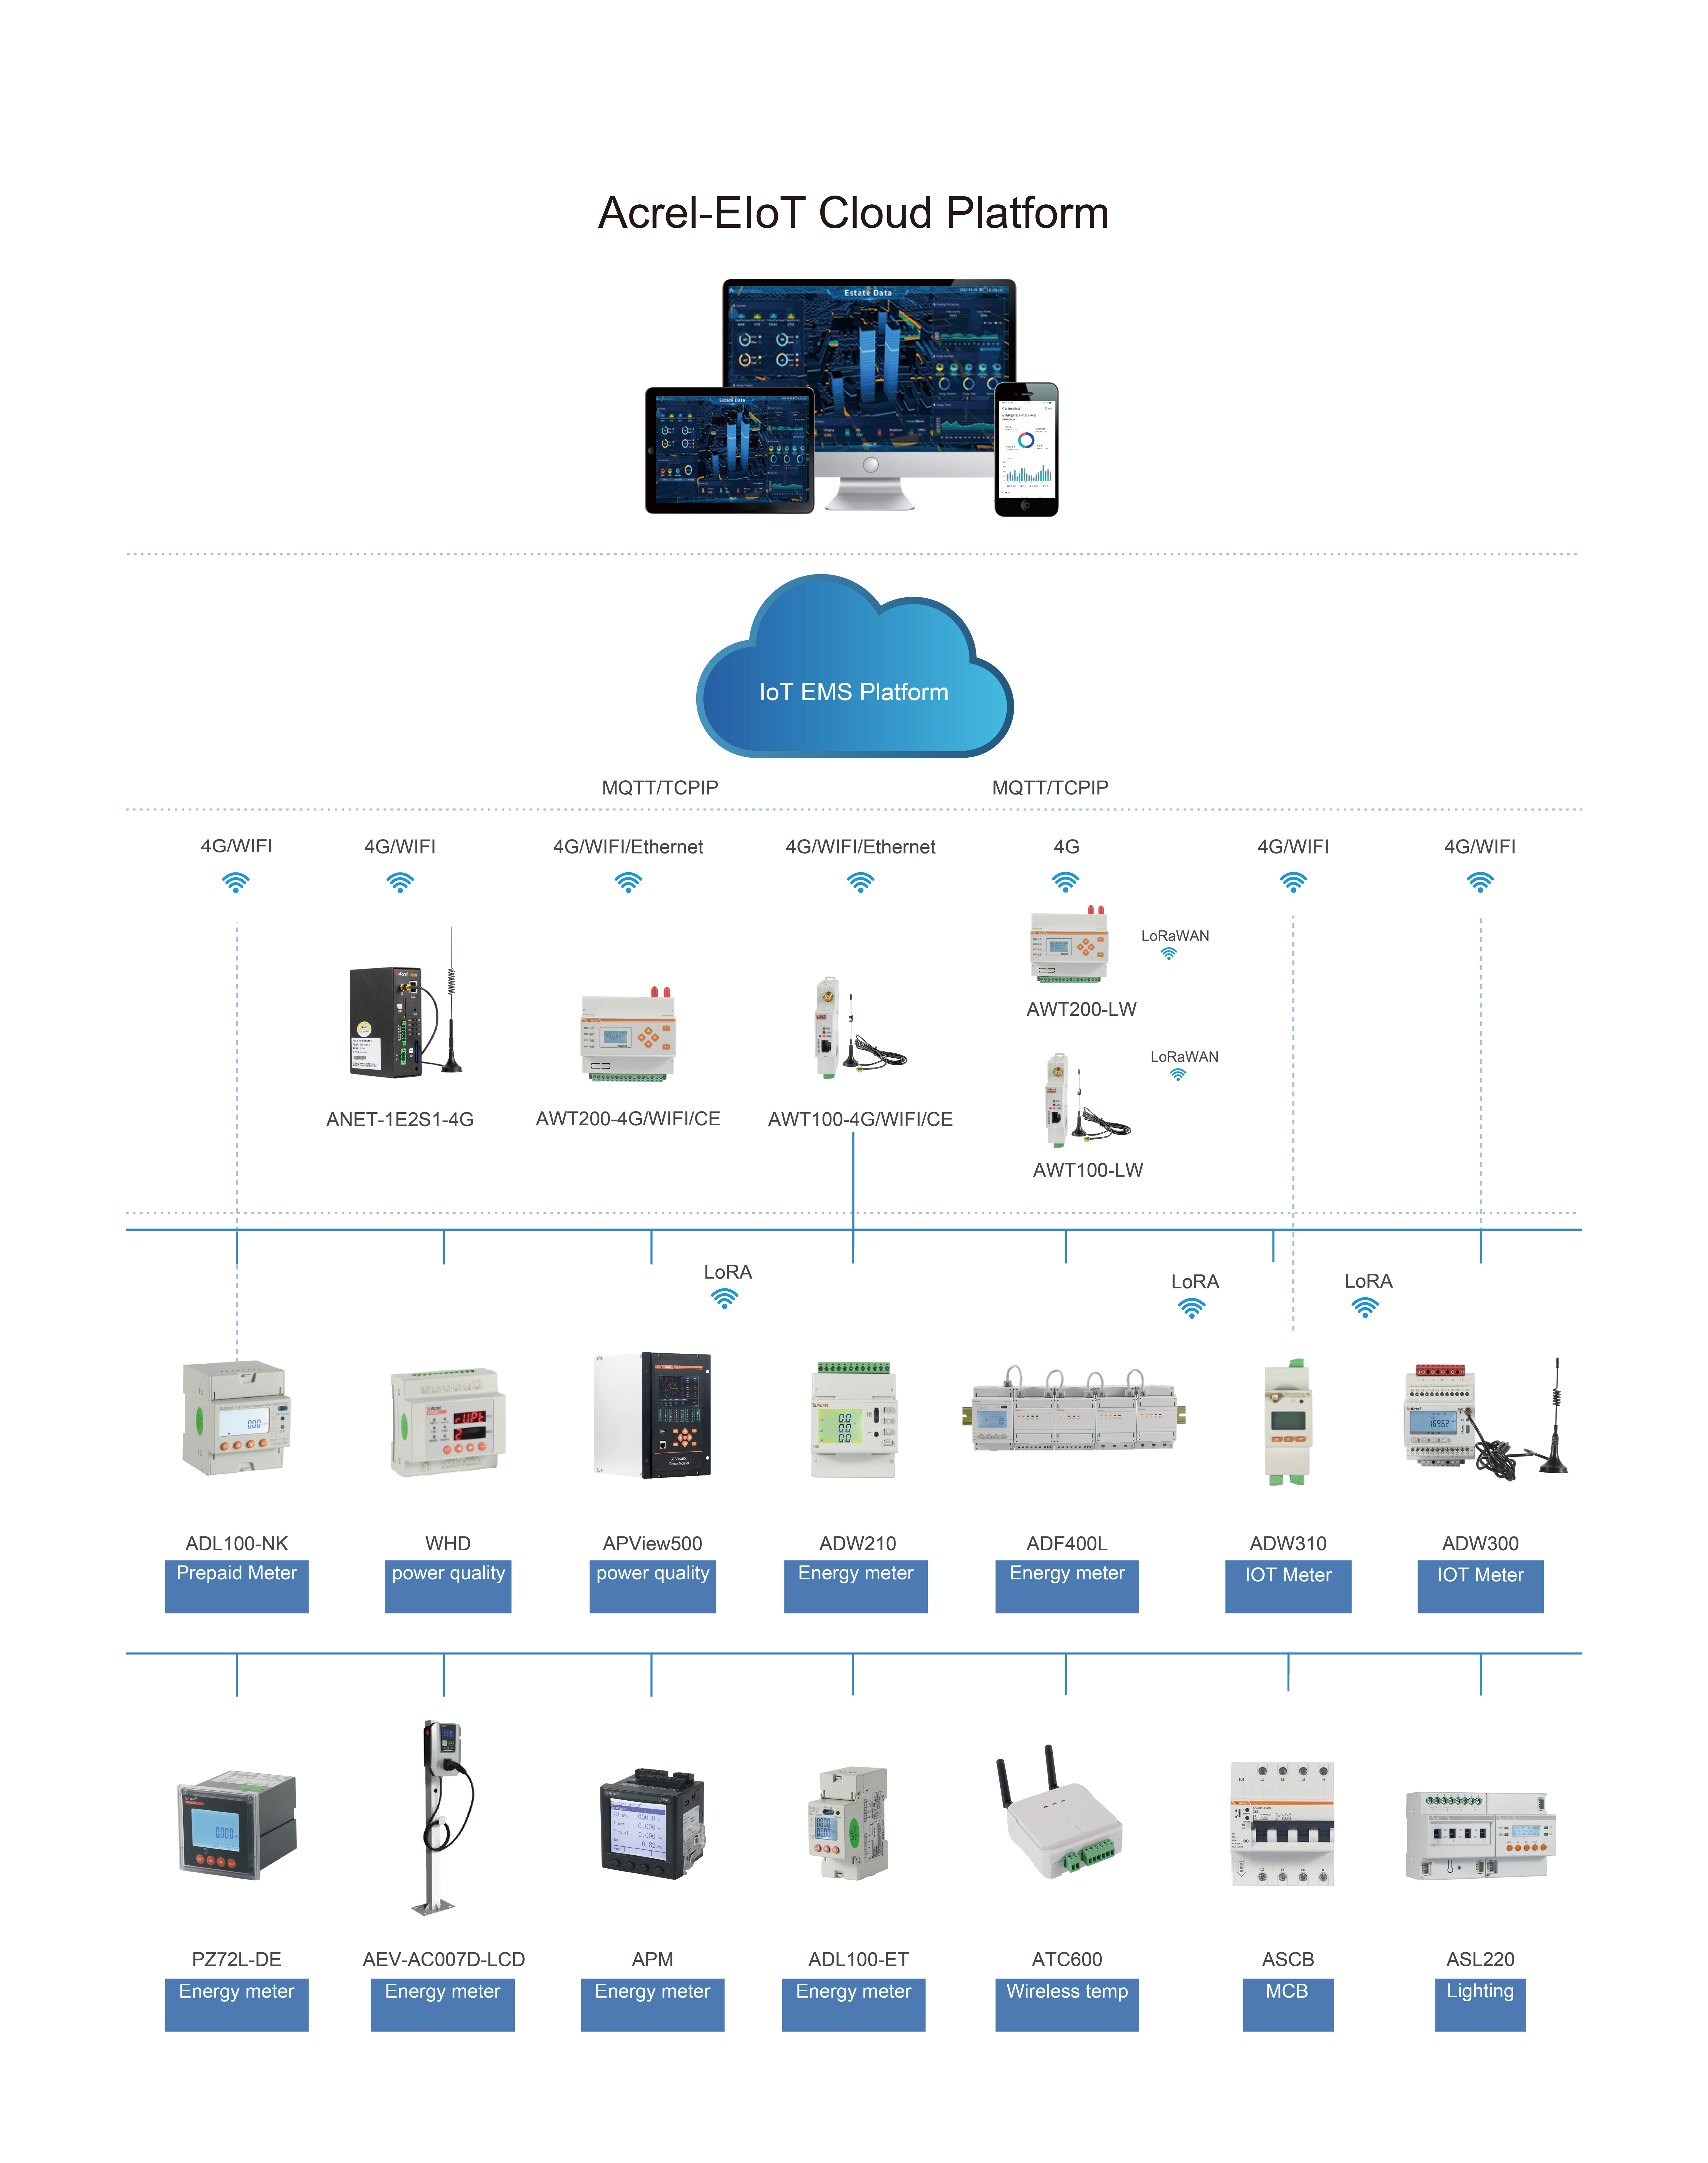
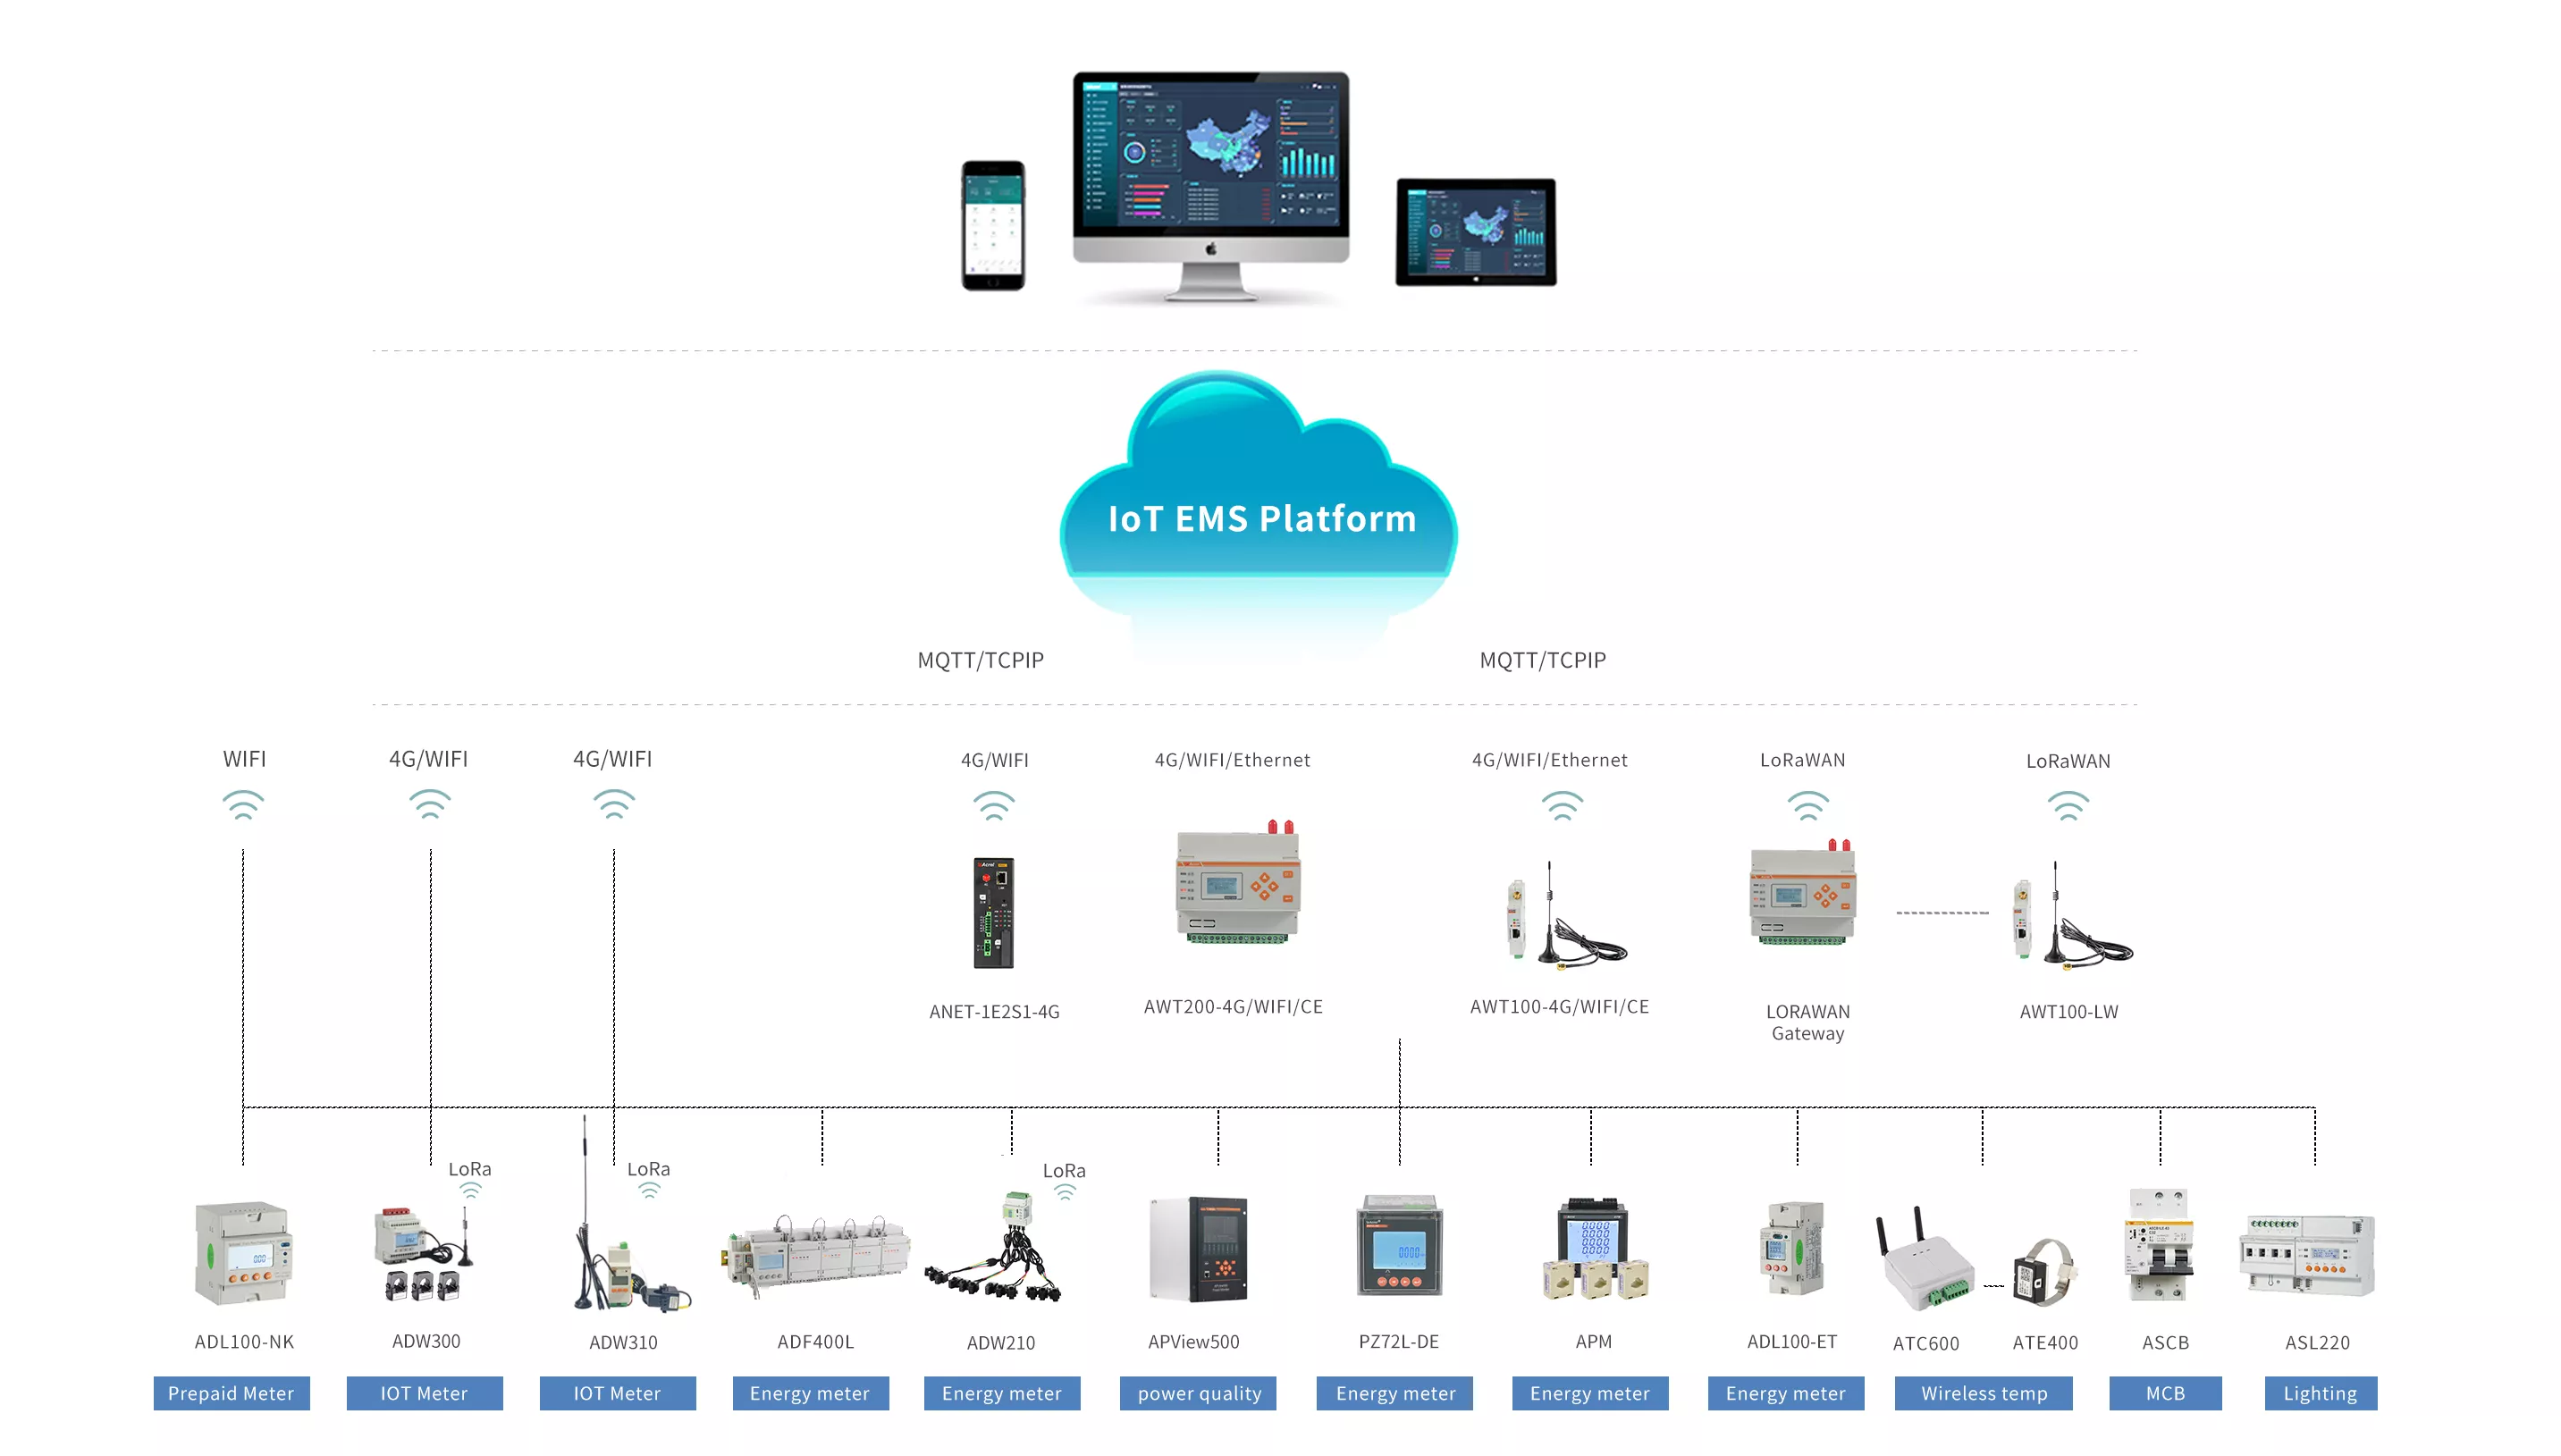
IoT EMS platform adopts a layered and distributed structure, which is mainly composed of three parts: perception, network layer and platform layer.
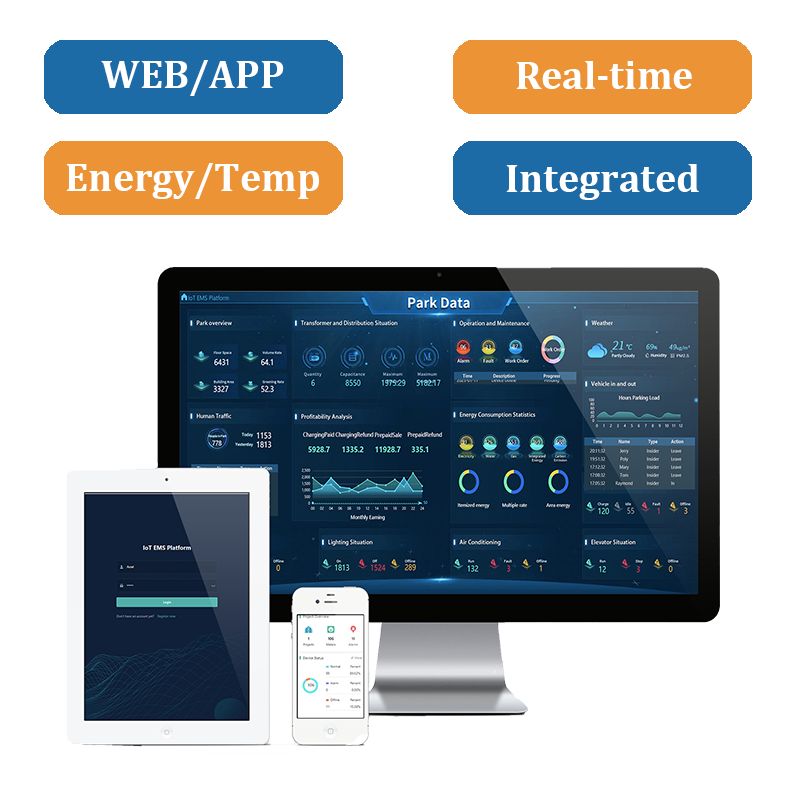
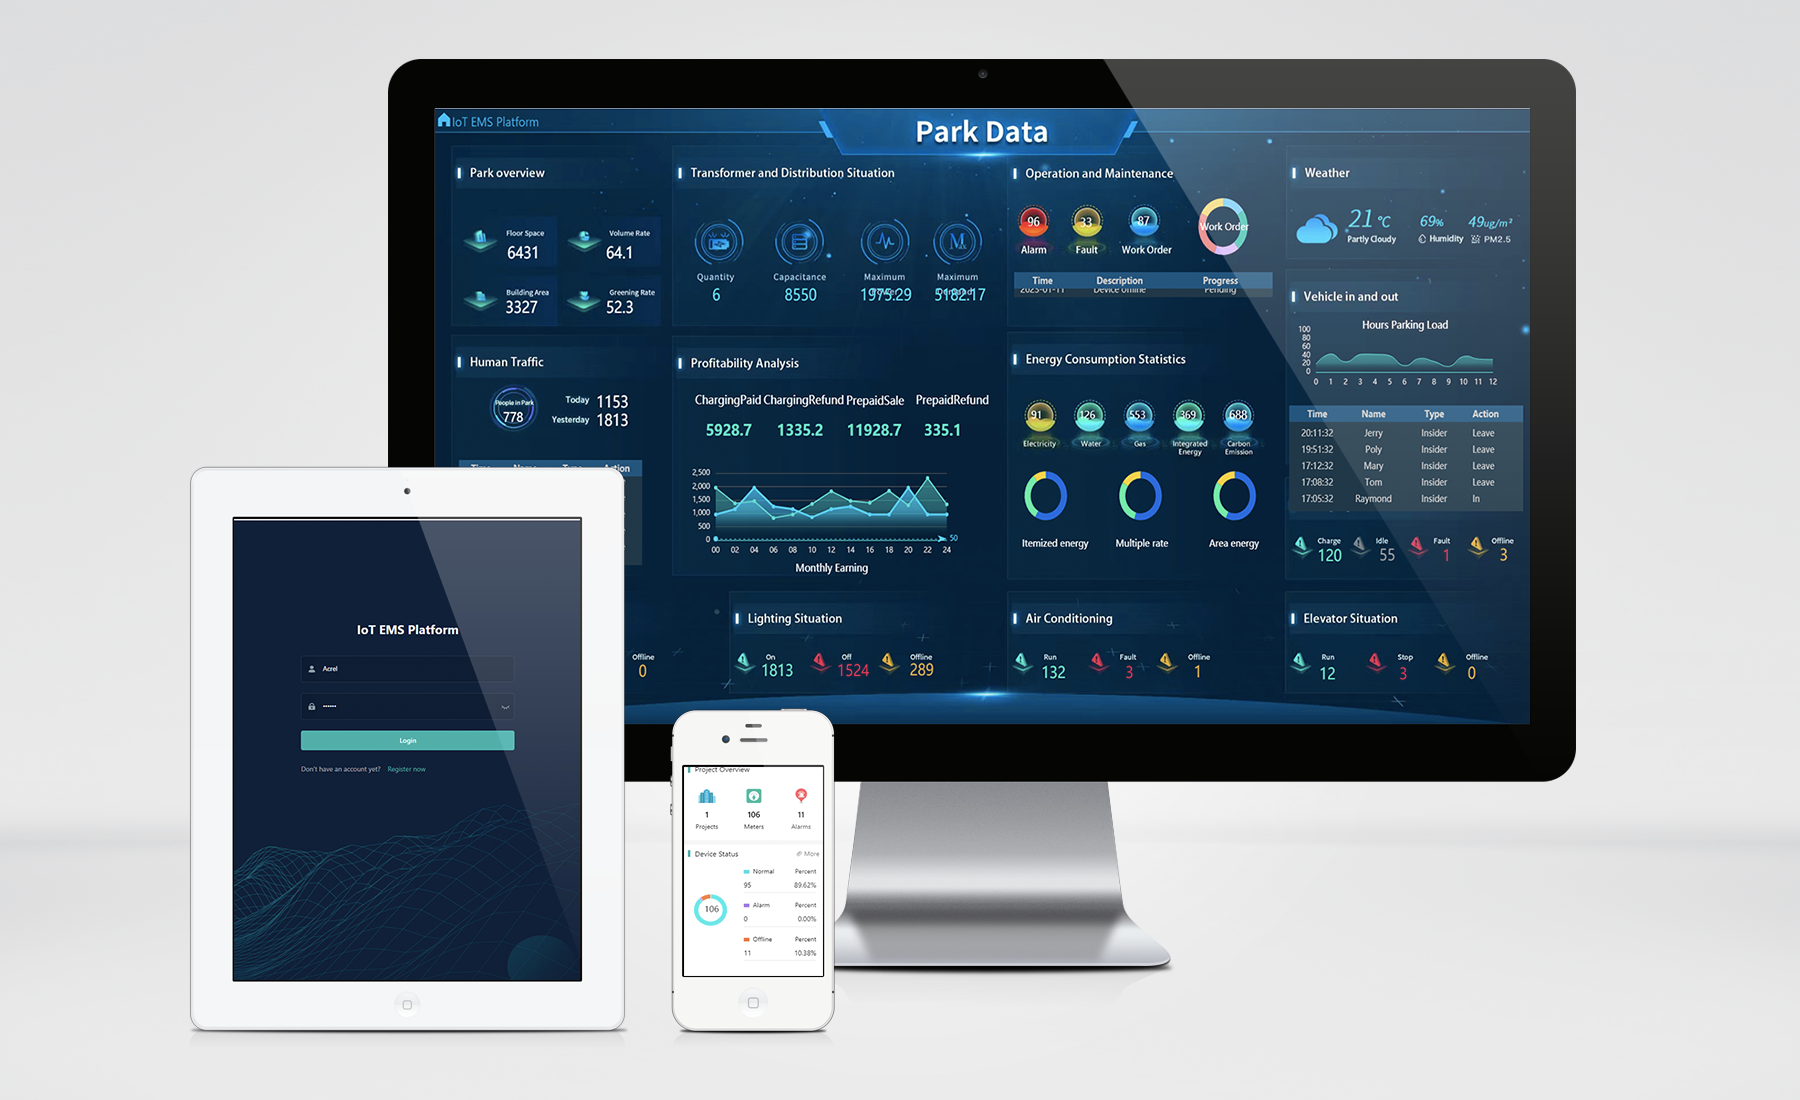
● Platform layer: including application server and data server, which can implement applications on PC or mobile.
● Network layer: The intelligent gateway collects the data of the perception layer, performs protocol conversion and storage, and then uploads the data to the IoT EMS platform.
● Perception layer: Various sensors connected to the network, including multi-function meters, multi-loop meters, IoT meters, street light controllers, etc.
Function
Monitoring
Real-time monitoring of environmental parameters such as room temperature and humidity, smoke detection, and water immersion of each power distribution.
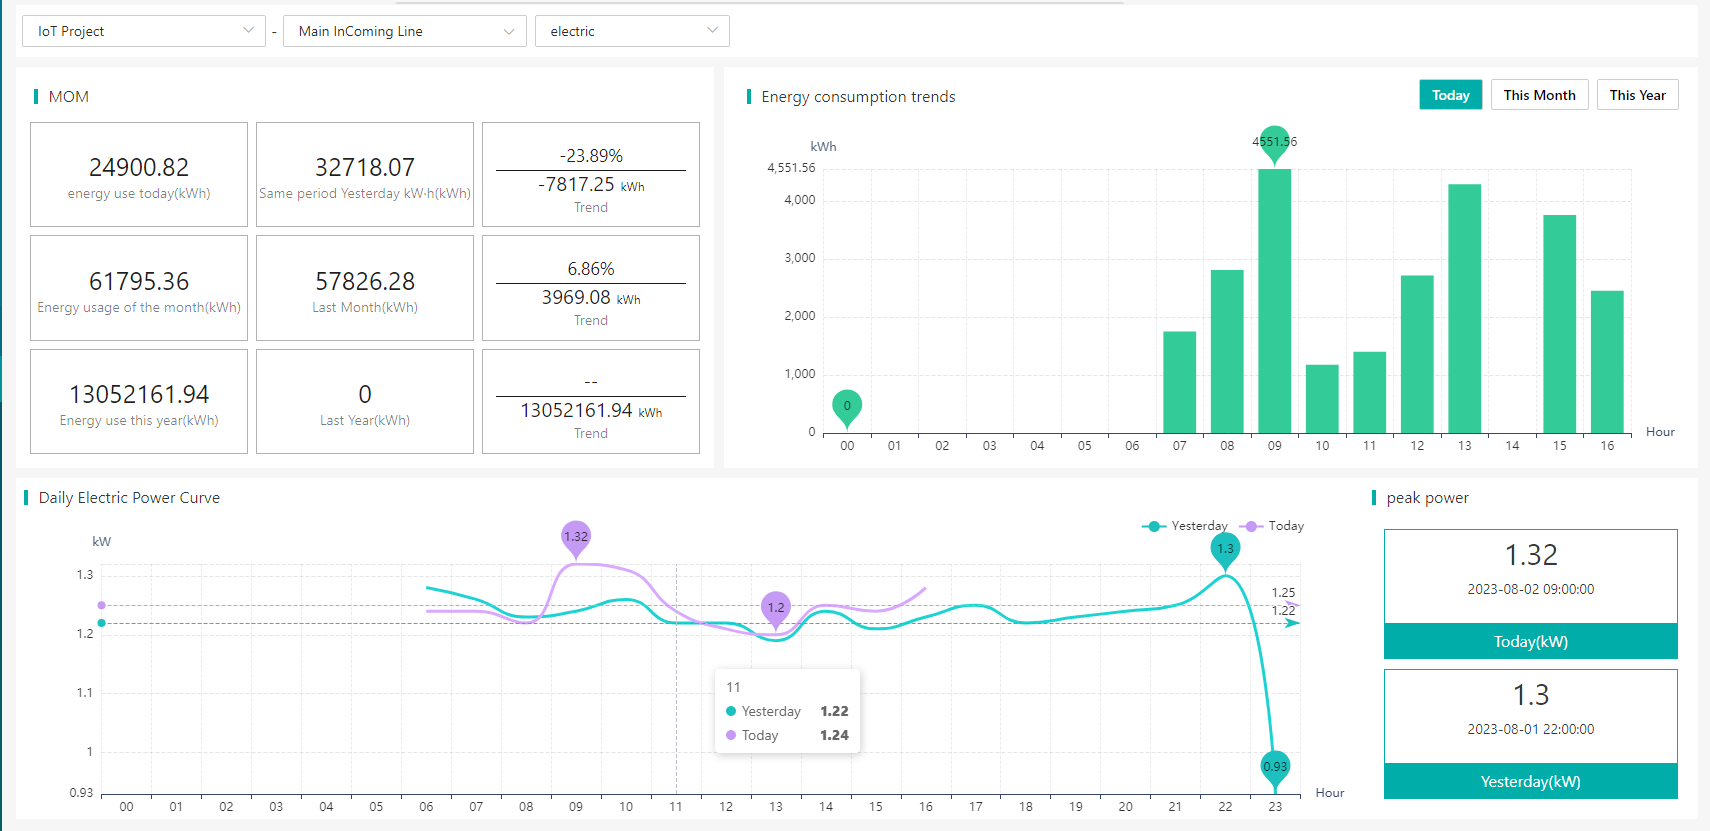
Real-time monitoring of the operating status and energy parameters of the transformer, to calculate the loss, to find the best economic operating range, reduce the loss and save electricity.
Energy Consumption Analysis
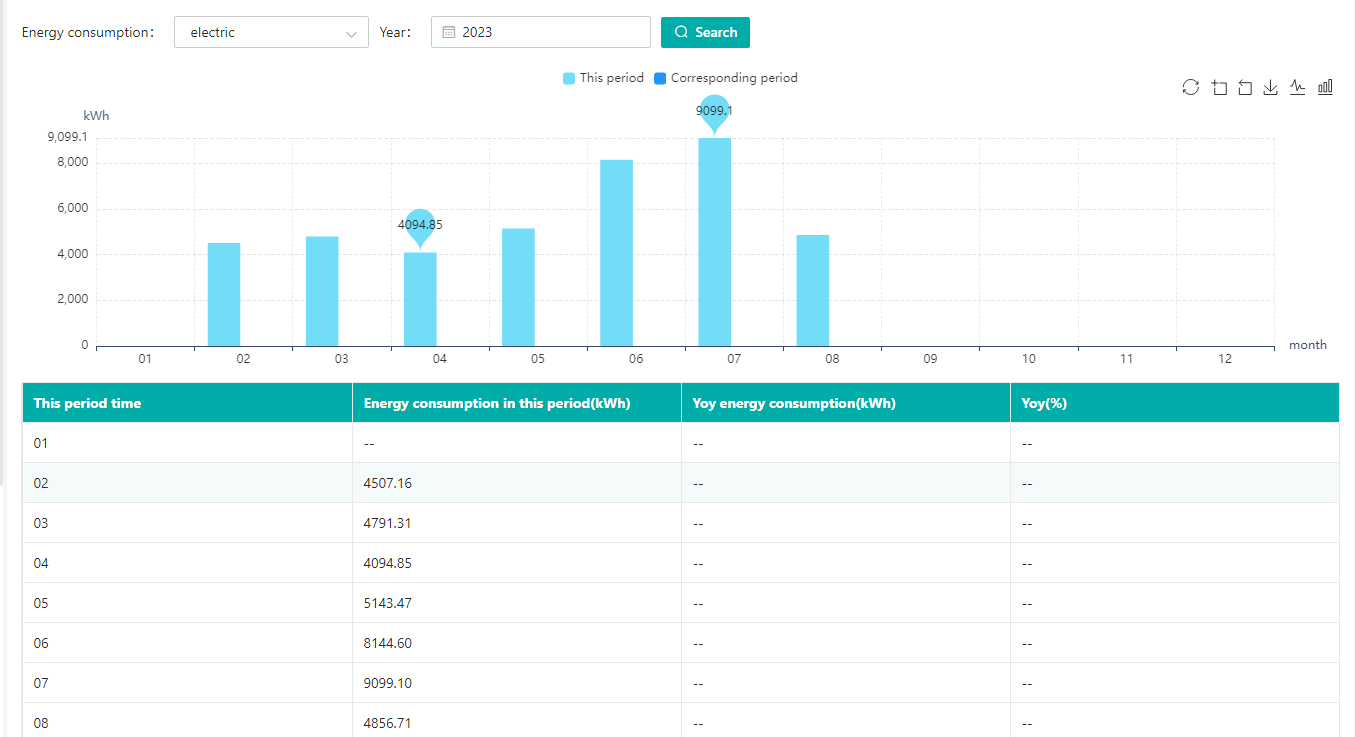
View the power consumption of each power circuit in a specified period, display the corresponding energy consumption trend graph and perform year-on-year analysis.
View the power consumption of each power circuit by day, month and year, which can be exported to an excel sheet.
Alarm Management
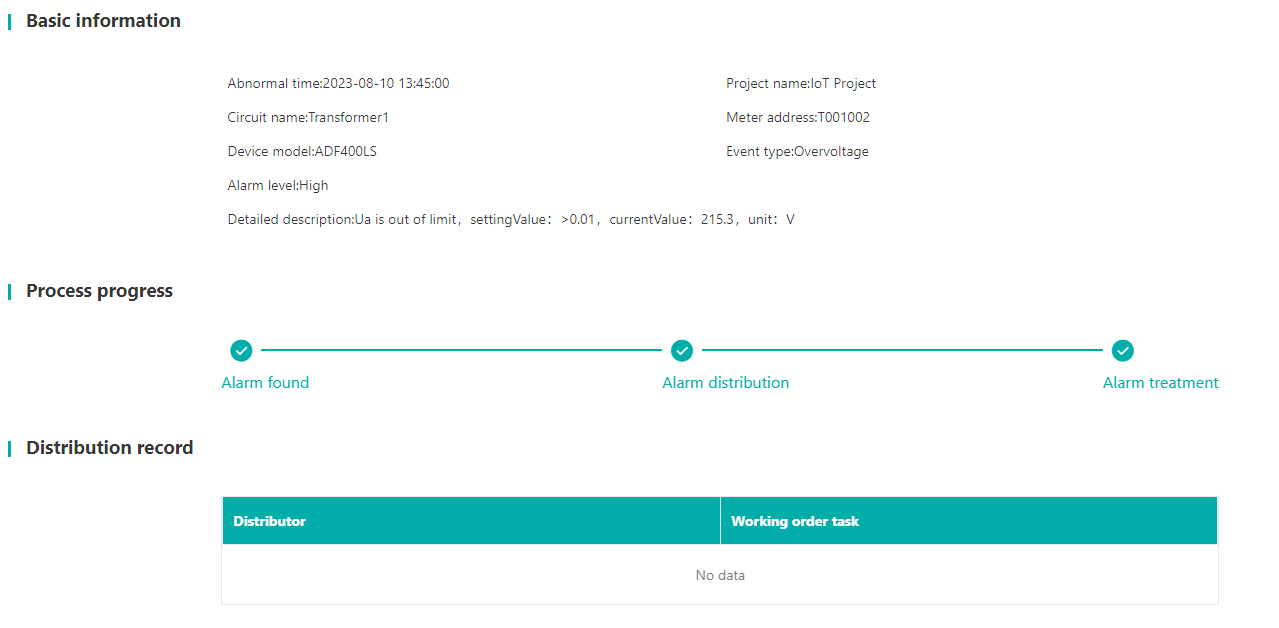
Actively report the alarm information, dispatch work orders, reasonably arrange the corresponding staff and relevant persons in charge to deal with them as soon as possible, and support uploading of attachments.
Display the alarm records of the equipment, and the alarm levels are divided into three levels: general, emergency, and serious.
Track the progress of alarm processing throughout the process, including work order dispatch and work order processing results.
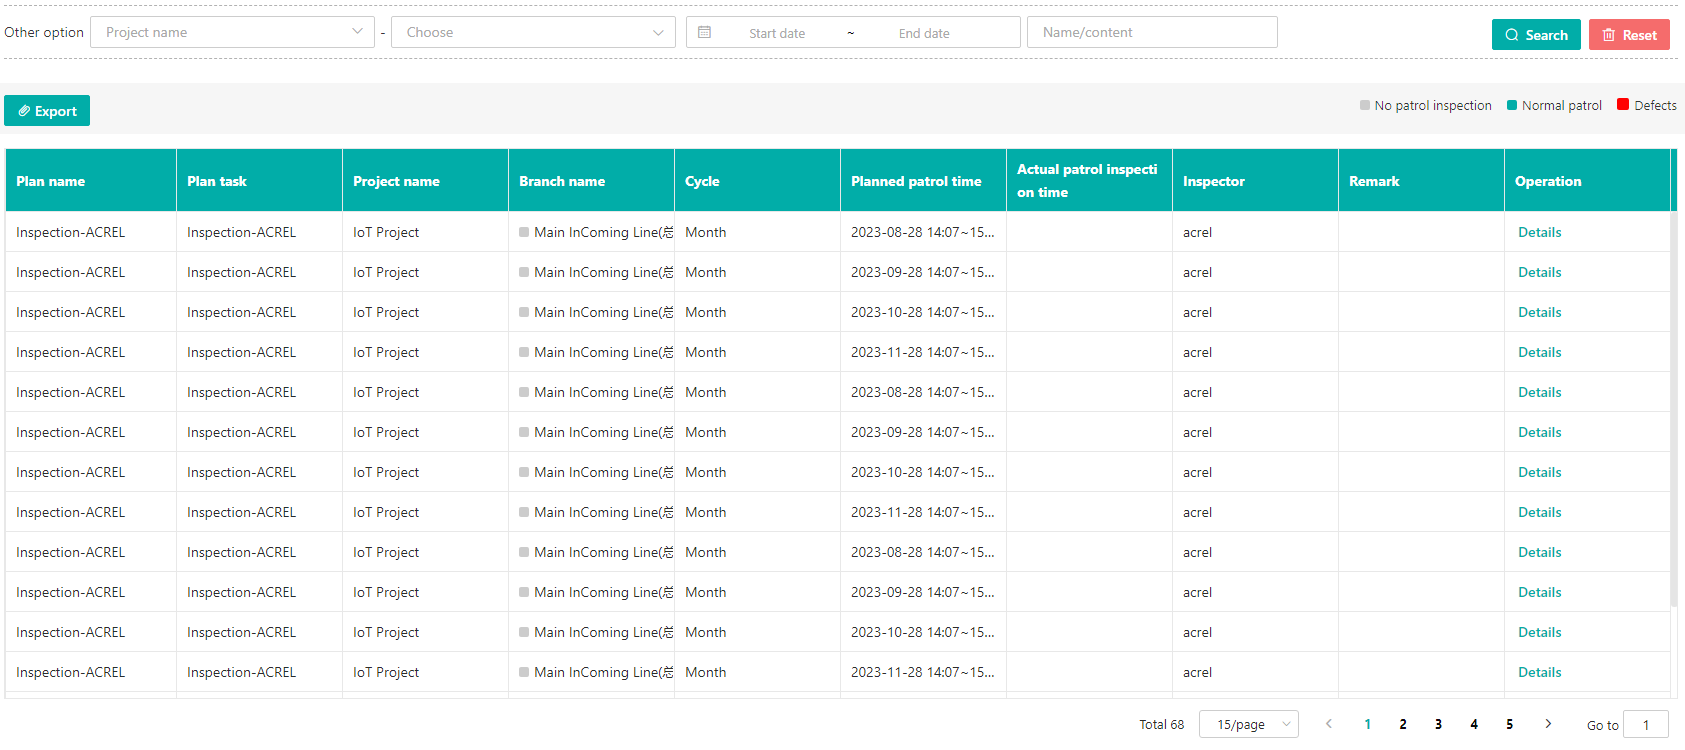
Operation & Maintenance Management
The system specifies the inspection plan, and sends the inspection plan to the mobile phone of the inspector. After the inspector arrives at the scene, he scans the NFC chip to confirm that he has arrived at the inspection site, and then performs the inspection task according to the inspection requirements.
Advantange

Easy to Deploy
√ Support the deployment of virtualized cloud computing platform, without considering the compatibility of IT equipment
√ Supports public and private cloud deployments
√ Support a variety of communication protocols and interface standards, support customized development, and facilitate the rapid connection of various data systems

Data Analysis
√ Big data analysis based on artificial intelligence technology provides data support for energy conservation management and decision-making basis for the government to formulate industrial policies
√ IoT-based architecture, supporting massive data concurrency and unlimited system capacity expansion
√ Combining professional analysis algorithms and data models

Easy to Use
√ Rich graphical interface presents various management functions, which is convenient and easy to understand
√ Support report and report template customization, and automatically generate various analysis reports and reports
√ Set of 11 subsystems, the objects cover buildings, infrastructure and equipment, personnel, vehicles, environment, etc., the solution is integrated

Easy to Maintain
√ Cloud platform deployment
√ Hardware quality optimization
√ System supports remote maintenance
√ Provide users with integrated software and hardware solutions, fast service response and convenient after-sales
Typical Diagram
Application Scene